BWP TRUST ANNUAL REPORT 2015
3
2015 HIGHLIGHTS
DISTRIBUTION PER UNIT
15.84
CENTS
TOTAL INCOME
$144.9
M
NETTANGIBLEASSETS PER UNIT
$2.24
>> 13.7 per cent increase in income to $144.9 million for the year
>> Final distribution of 8.17 cents, bringing the full year
distribution to 15.84 cents, up 7.7 per cent, on the
previous year
>> Acquired the Australind Bunnings Warehouse development site
and newly constructed store, and completed the development
of the Manly West, West Ipswich, Brendale and Maribrynong
Bunnings Warehouse stores
>> Finalised the upgrade of the Minchinbury Bunnings Warehouse
store, and progressed the upgrade of the Lismore and
Rockingham stores
>> Completed the divestment of six non-core properties
>> 20 market rent reviews were finalised during the year –
weighted average 8.2 per cent increase in annual rent; including
17 Bunnings Warehouses – weighted average 8.0 per cent
increase in annual rent
>> Like-for-like rental growth of 2.6 per cent for the 12 months to
30 June 2015, compared to an adjusted 4.0
1
per cent for the
previous year
>> Repriced and extended all bank facilities, and reduced unused
facilities by $45 million
>> Weighted average cost of debt of 5.5 per cent for the year, 5.0
per cent at financial year end
>> Weighted average lease expiry of 6.6 years at 30 June 2015,
with 100 per cent occupancy
>> Net revaluation gain on the property investment portfolio of
$108.5 million for the year
>> Net tangible assets of $2.24 per unit at 30 June 2015,
up 8.2 per cent on the previous year
>> Gearing (debt/total assets) 24.1 per cent at 30 June 2015
1
Includes market rent reviews for the 2013/14 financial year that were
finalised in 2014/15
0
5
10
15
20
25
30
one year
three years
2
five years
2
ten years
2
BWP Trust (BWP)
ASX All Ordinaries Accumulation Index
UBS Retail 200
S&P/ASX 200 Property Accumulation Index
S&P/ASX 300 Property Accumulation Index
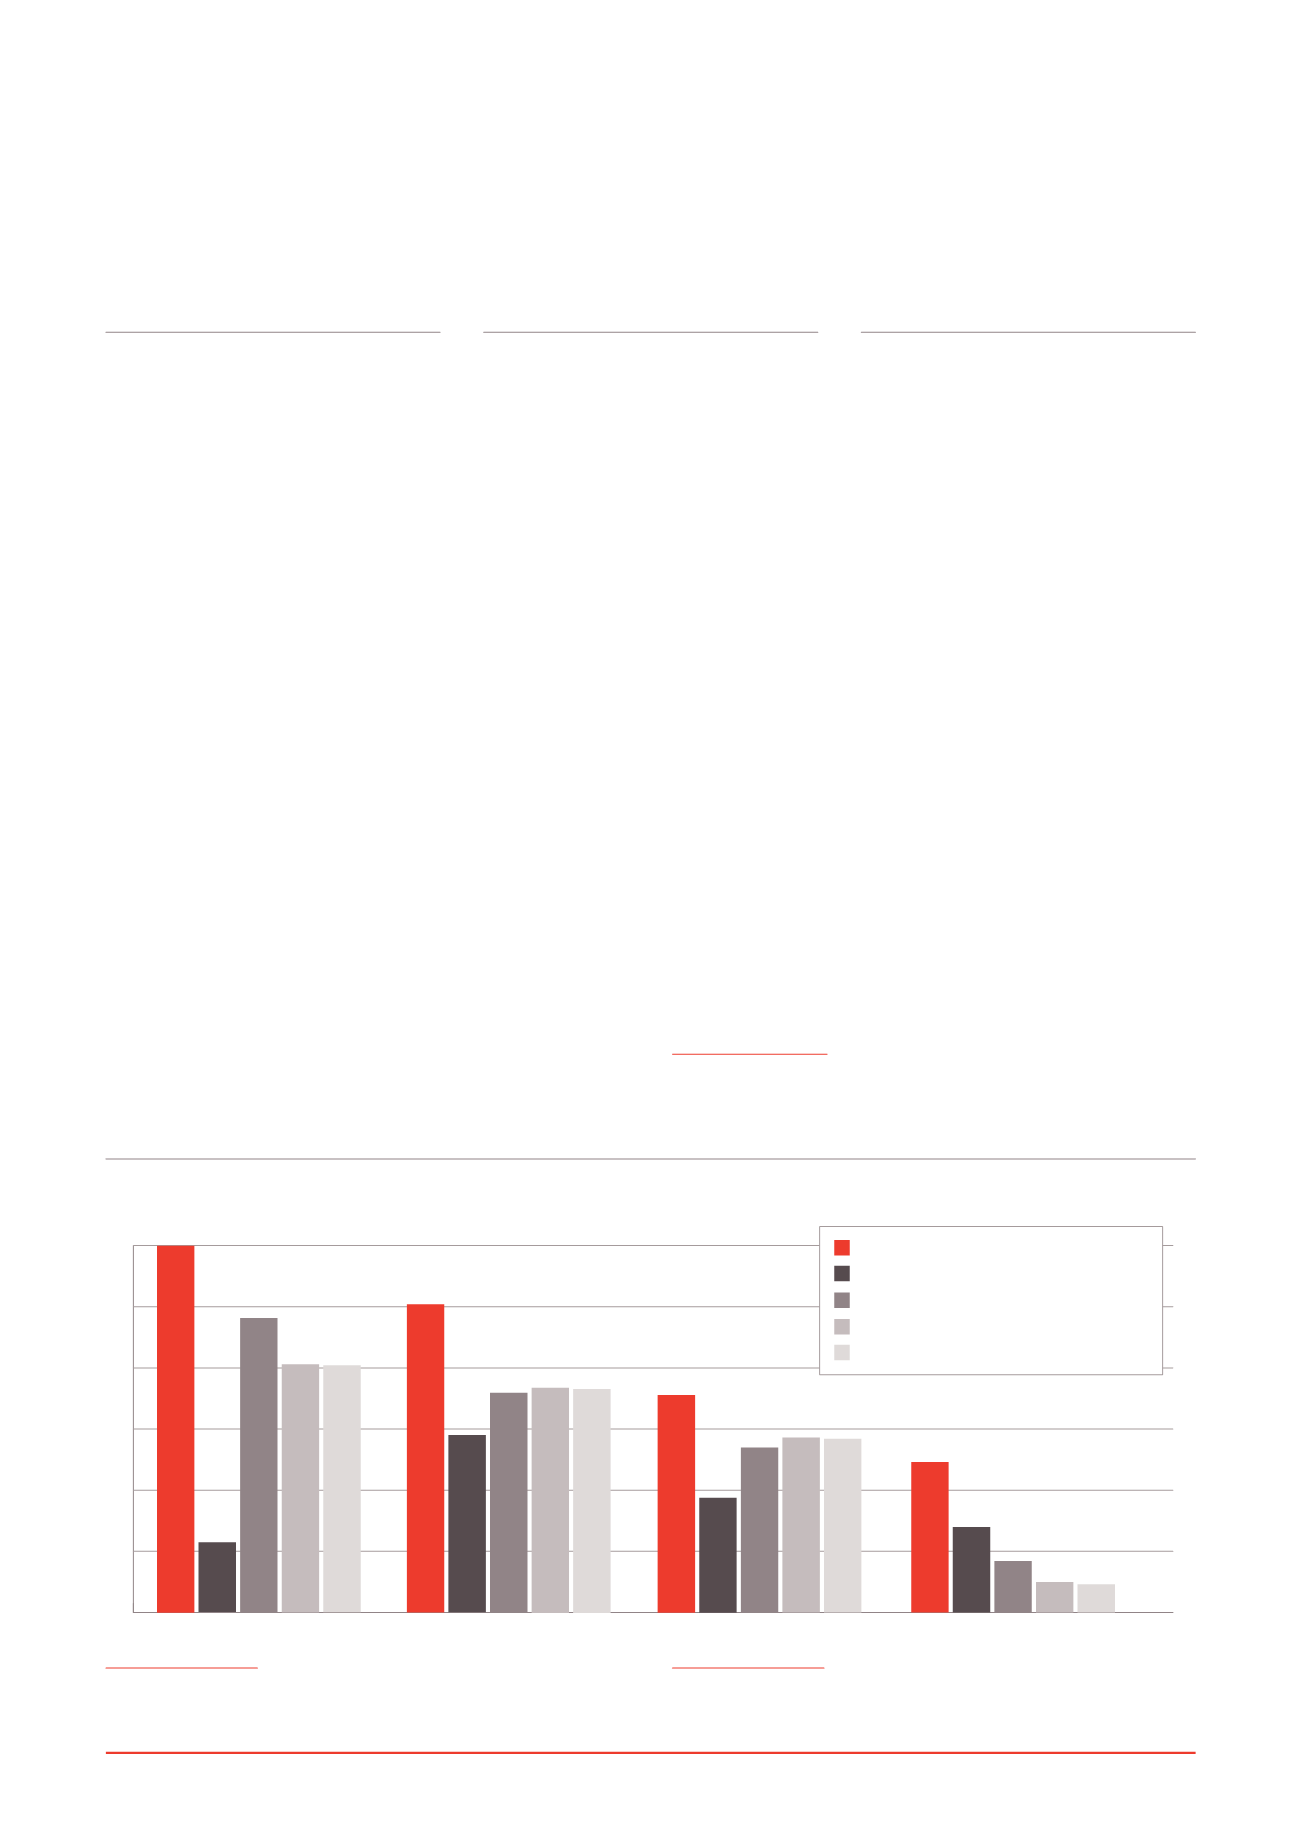
30.0
25.2
14.5
18.0 18.4 18.3
17.8
9.4
13.5
14.3 14.2
12.3
7.0
4.2
2.5 2.3
5.7
24.1
20.3 20.2
BWP TOTAL RETURNS COMPARED TO MARKET PERIODS ENDED 30 JUNE 2015 (%)
1
1
Total returns include distributions and movement in price (assumed
distributions are reinvested). Source: UBS Australia.
2
Annual compound returns
OVERVIEW


