BWP TRUST ANNUAL REPORT 2015
6
Rental growth from the existing property investment portfolio, completed developments, and improvements
to existing properties, contributed to a 13.7 per cent increase in total income, which together with a 10 per cent
reduction in the weighted average cost of debt, increased the distributions per unit to 15.84 cents, 7.7 per cent
higher than last year.
FINANCIAL RESULTS
INCOME AND EXPENSES
Total income for the full-year to 30 June 2015 was $144.9 million,
up by 13.7 per cent from last year. The increase in income was
mainly due to rental growth from the existing property portfolio,
and additional rental income from developments completed during
the year. On a like-for-like basis, excluding rental income from
properties acquired or upgraded during or since last year, rental
income increased by approximately 2.6 per cent from last year.
Finance costs of $25.8 million were 23.5 per cent higher than
last year due mainly to the average level of borrowings of $462.7
million being 39.2 per cent higher than the previous corresponding
period. The weighted average cost of debt for the year (finance
costs less finance income, as a percentage of average borrowings)
was 5.5 per cent, compared to 6.1 per cent for the previous year.
The reduced cost of debt was the result of lower floating and fixed
interest rates, and reductions in funding costs and margins
during or since last year. At financial year end the cost of debt
was 5.0 per cent.
Other expenses of $6.4 million for the year were 7.2 per cent higher
than last year, due to an additional $1.0million in non-recoverable
outgoings including land taxon properties located in Queensland,
acquired during or since last year. The majority of the increase in
non-recoverable outgoings is reflected in an increase in rental income
for the period relating to the purchase of properties during the year.
The management expense ratio for the year ended 30 June 2015
(expenses other than property outgoings and borrowing costs as a
percentage of average total assets) was 0.65 per cent (2014: 0.64
per cent).
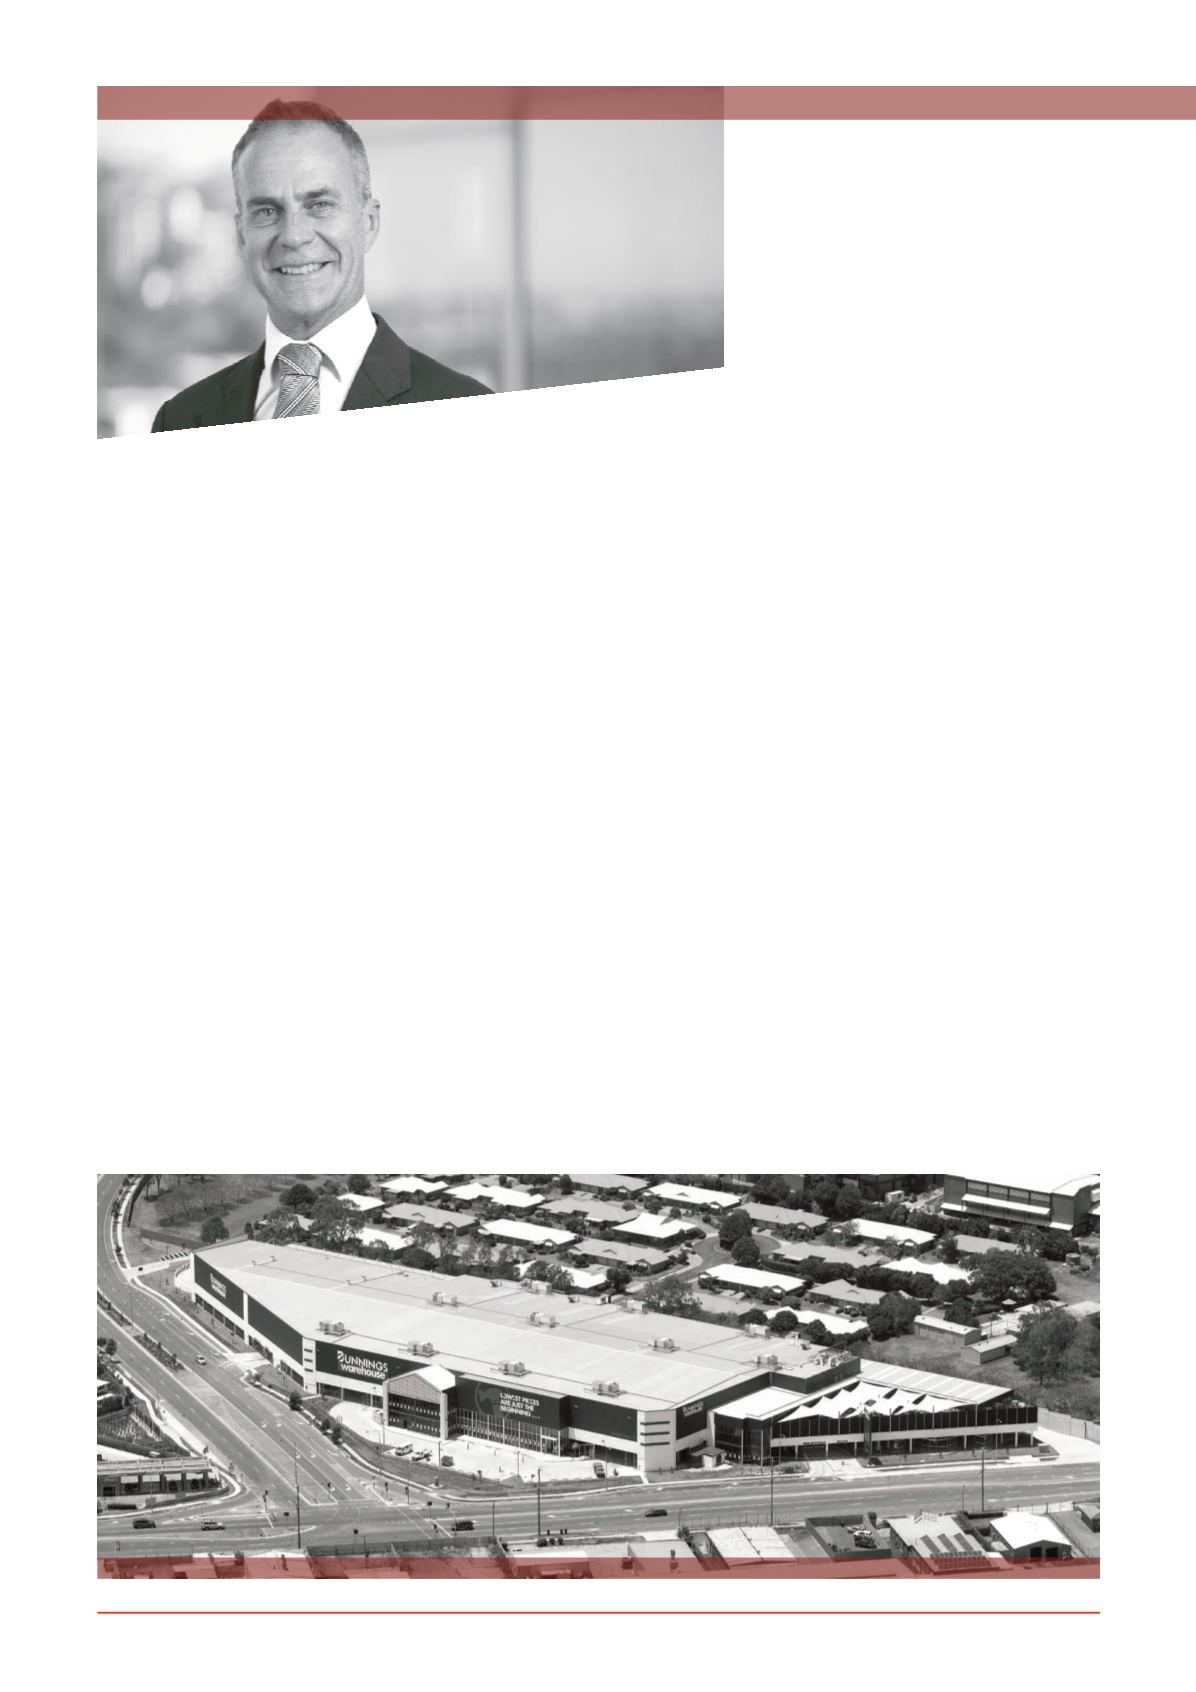
Manly West, QLD
MANAGING
DIRECTOR’S
REPORT
BUSINESS REVIEW


